Equity Diversification in an Era of Concentration
August 10, 2026
Tech and AI are driving a greater share of global equity market returns and earnings growth, raising concentration risks and the need for broader diversification.

Key takeaways
- The broad global equity indexes have become more concentrated due to an increased weight of the Information Technology and Communication Services sectors and the recent capital investment related to artificial intelligence (AI), which has seen an increased share of earnings growth from an overlapping group of firms.
- The concentration on one dominant growth driver has increased the risks for investors. A handful of technology companies are delivering over half the entire global market's earnings growth, which is being fueled by the massive spending of the largest of these same companies. The risk is an unexpected deceleration of AI-related capital spending, which could result in downward revisions in future earnings for broad passive indexes.
- The investment principle of diversification suggests investors diversify their portfolios by investing across asset classes, within asset classes, and across investment styles. Diversification can help smooth returns and lessen the impact of a poor outcome from a single holding. The issue for the equity asset class is that the broad passive global equity indexes have become less diversified due to the increased concentration on one growth driver.
- By looking beyond the broad passive large capitalization (cap) indexes, investors can improve equity diversification by adding any of the following to portfolios; international equities, stocks in sectors and industries with low correlation to the AI trade, small cap equities, and investments that are benchmarked to indices using alternatives to market capitalization weighting schemes, such as equal-weight or fundamental factors such as Value and Yield.
What do we mean by market concentration and why is it relevant?
Market concentration has become a defining characteristic of today's global equity market. This concentration has shifted passive equity portfolio exposures toward technology and away from everything else, reshaping the risk-versus-return assessment for investors. More recently, it has also become intertwined with the AI investment wave producing extraordinary earnings growth for a narrow set of industries and companies.
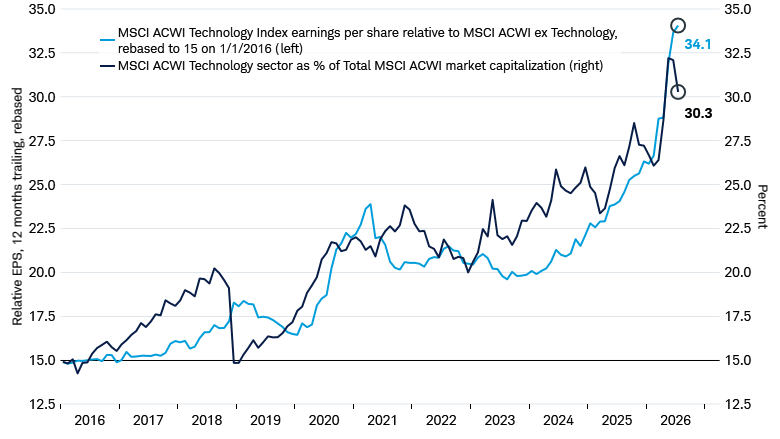
At a global level, the Information Technology (Tech) sector's market cap as a percentage of the MSCI All Country World Index (ACWI) has doubled over the past 10 years, from 15% at the start of 2016 to 30% today. However, over the same period, tech earnings per share (EPS) has grown at an even faster pace relative to the rest of the global market, supporting the arguments that tech's rise has been fundamentally driven and that concentration itself isn't a problem. Indeed, with the pace of ongoing technological innovation, the era of dominant tech firms may continue.
MSCI All Country World Index (ACWI): Tech sector market cap and Tech sector EPS as percentage of ACWI
Source: Charles Schwab, MSCI, and Macrobond, data from 1/1/2016 through 7/30/2026.
Indexes are unmanaged, do not incur management fees, costs, and expenses and cannot be invested in directly.
Past performance is no guarantee of future results.
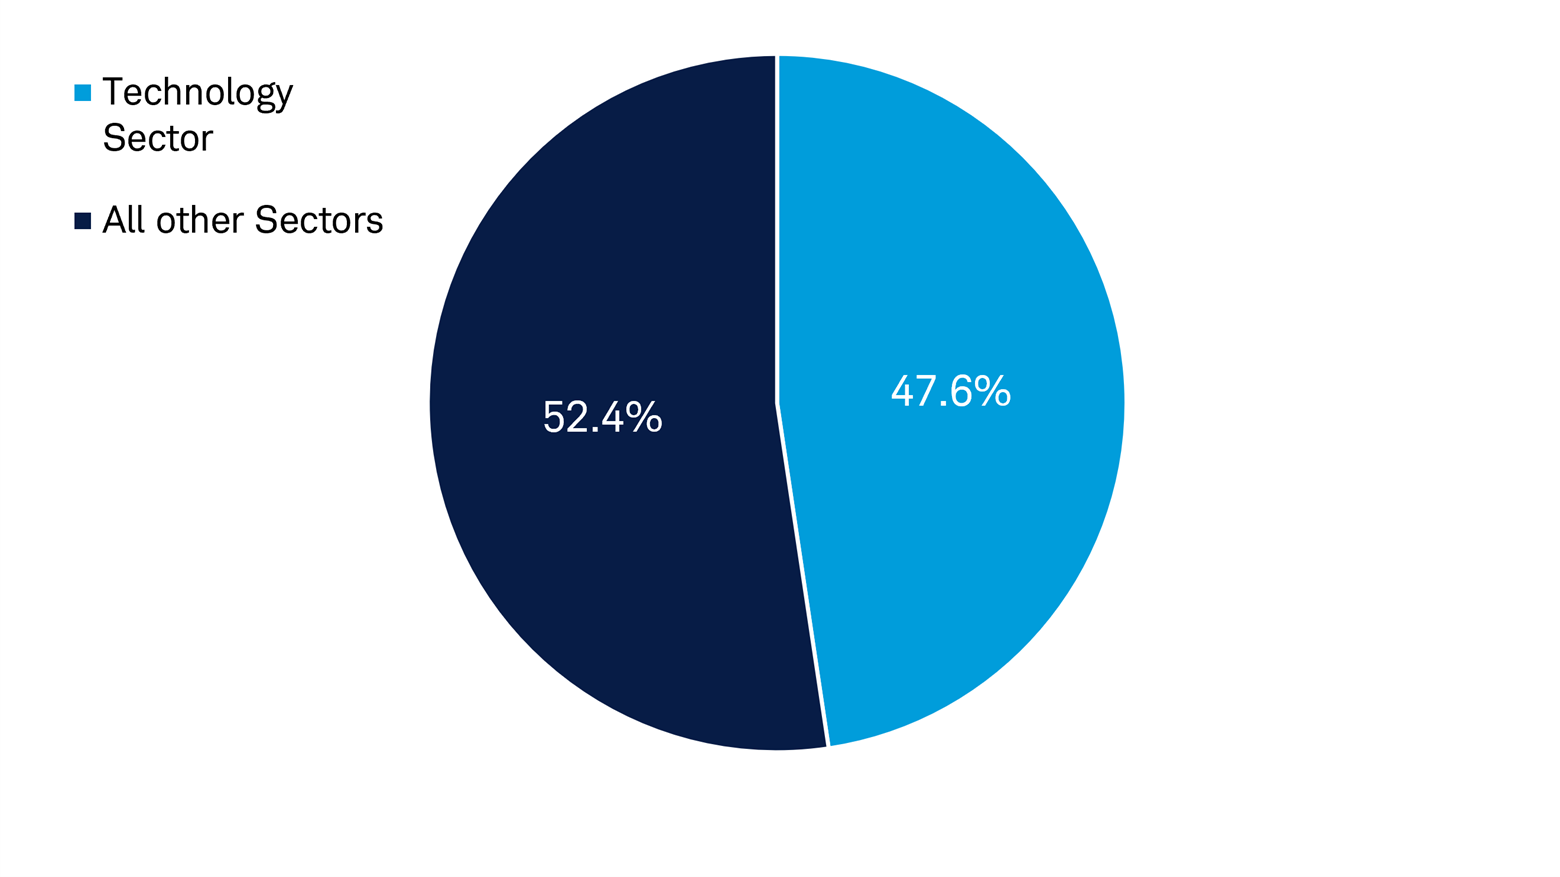
While we acknowledge the argument that market cap concentration is not necessarily a risk in isolation, we've also seen global earnings growth become dominated by a narrow set of tech-related industries and companies—thanks to the massive investment pouring into AI. For 2026, tech is expected to produce 47.6% of global earnings growth, based on the MSCI ACWI.
Rather, it's the combination of market cap and earnings concentration that presents a challenge for investors: we now have equity markets overwhelmingly comprised of tech companies, with a handful delivering over half the entire global market's earnings growth, which is being fueled by the massive spending by the largest of these tech companies.
The circularity of these conditions—and the large reliance on the AI theme—is where the risks add up. Fortunately, diversification strategies become more accessible when markets are highly concentrated and equity investors can pursue any number of ways to increase portfolio breadth.
Technology contribution to 2026 earnings growth in the MSCI ACWI
Source: Charles Schwab and FactSet data, as of 8/5/2026.
Indexes are unmanaged, do not incur management fees, costs, and expenses and cannot be invested in directly. Past performance is no guarantee of future results.
How investors can increase diversification today
It's important to note that diversification is not simply about owning more stocks or funds. Rather, it's about having exposure to differentiated sources of potential return. From a global equity perspective, this can come from any combination of geographic, sector, or factor exposure. We see opportunities in many of these areas today.
Diversification opportunity No. 1: Geographic
The period from the early 1990s through 2010 saw the steady expansion of globalization, a synchronization of global economic cycles, low inflation and declining interest rates, and increasing correlations across equity markets.
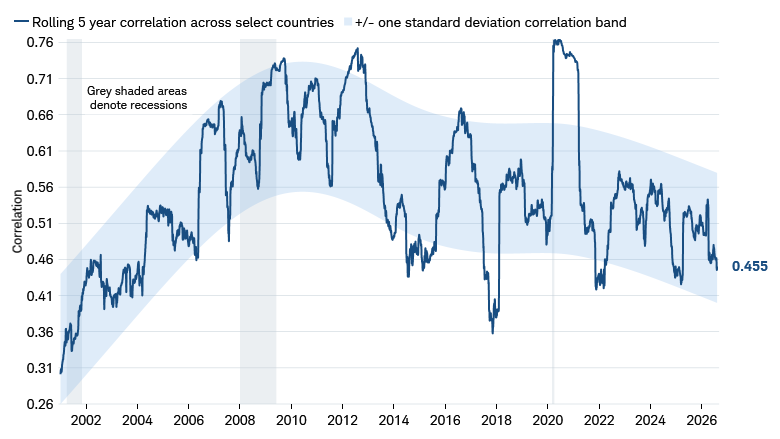
The Global Financial Crisis and the subsequent global policy responses helped herald a change to this world order. Fast forward to today and we've just experienced a 15-year run of extraordinary U.S. equity outperformance during which time globalization stalled, geopolitical tensions rose, regional economic cycles became desynchronized, inflation and rates moved higher, and country equity correlations fell.
Correlation of select MSCI country indices
Source: Charles Schwab, MSCI, and Macrobond data, from January 2001 through July 2026, as of 8/5/2026.
Note: Correlation measured on the weekly price changes across countries over the trailing 5 years.
The following indices were used in the correlation study: MSCI China, MSCI Brazil, MSCI Canada, MSCI Germany, MSCI India, MSCI Japan, MSCI Korea, MSCI United Kingdom, MSCI USA, MSCI Switzerland, and MSCI Taiwan. Indexes are unmanaged, do not incur management fees, costs, and expenses and cannot be invested in directly.
Correlation is a statistical measure of how two investments have historically moved in relation to each other, and ranges from -1 to +1. A correlation of +1 indicates a perfect positive correlation, while a correlation of -1 indicates a perfect negative correlation. A correlation of zero means the assets are not correlated.
Past performance is no guarantee of future results.
While today's leading U.S. companies, particularly in the Technology sector, are forecast to continue delivering EPS growth above broader market levels, based on consensus estimates, and we've seen steady earnings growth in most major regions and sectors, reflective of ongoing cyclical economic expansion.
Moreover, with the rise in geopolitical tensions, many countries are increasing efforts to stimulate domestic growth and insulate their economies from external shocks. Policy makers in Europe, Japan, and emerging markets are reassessing domestic security, which includes military defense, energy security, food security, and—increasingly—industrial security.
This is not to say we expect a reversal in U.S. versus global market performance any time soon. The U.S. continues to enjoy a number of advantages that could sustain faster relative growth. Indeed, we continue to suggest that investors retain their strategic allocation to the U.S. equity market.
But it's important to acknowledge how conditions have changed over the last 15-plus years of U.S. outperformance, including the macroeconomic and geopolitical environment as well as market conditions including overall capitalization and valuations, investor positioning, consensus expectations, etc. These factors all lead us to the view that equity investors may be well served to consider more actively balancing geographic exposure.
Adding or increasing allocations to major regional markets likely widens exposure to different return drivers—from broad economic drivers to different sector exposures as well.
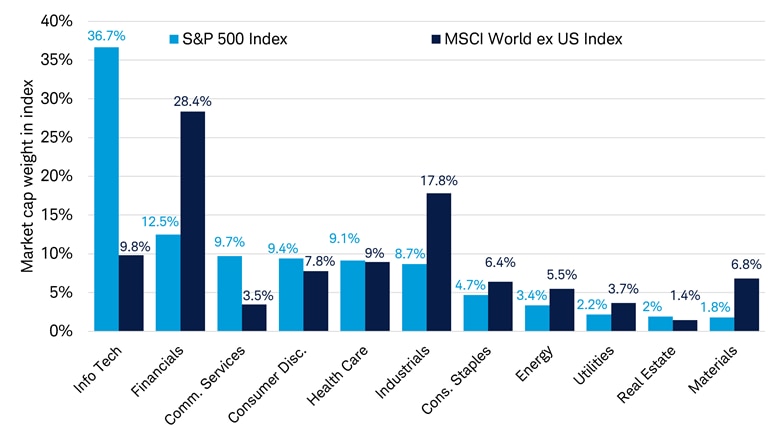
The MSCI World excluding the USA Index covers all major developed markets and has a significantly different sector composition than U.S. equity markets. For example, the Tech sector, which is nearly 37% of the S&P 500, is just 10% in the MSCI World ex USA Index. On the other side, global developed markets have much higher exposures to the Financials, Industrials, Energy, and Materials sectors versus the U.S. market.
Current sector exposures in the S&P 500 and MSCI World ex USA Index
Source: Charles Schwab and Bloomberg, data as of 7/31/2026.
For illustrative purposes only. Global Industry Classification Standard (GICS®) was developed by and is the exclusive property of MSCI Inc. (MSCI) and Standard & Poor’s (S&P). GICS is a service mark of MSCI and S&P and has been licensed for use by Charles Schwab & Co, Inc.
Diversification opportunity No. 2: Sector and factor diversification
It's absolutely true that if one had held a highly concentrated portfolio of large cap U.S. technology stocks, they would have outperformed significantly over that last decade. The Magnificent 7 didn't get that moniker because they underperformed. Said differently, being underweight tech and the fastest-growing stocks over the last decade would have likely resulted in underperformance.
However, starting points matter. Today's circumstances are quite different than they were just 10 years ago. And it's not just about the large market weight of tech, but also the added concentration of rapid investment from mega-cap tech firms fueling dramatic earnings of other tech companies in the AI supply chain. Today, tech valuations are high on both an absolute and relative basis with markets seemingly discounting sustained strong growth and profitability with very high earnings expectations throughout next year.
All of this raises the bar for tech to continue to surprise to the upside. Moreover, should downside scenarios materialize—or even become more likely—the sheer weight of the Technology sector in portfolios could pose a challenge for risk management and return requirements.
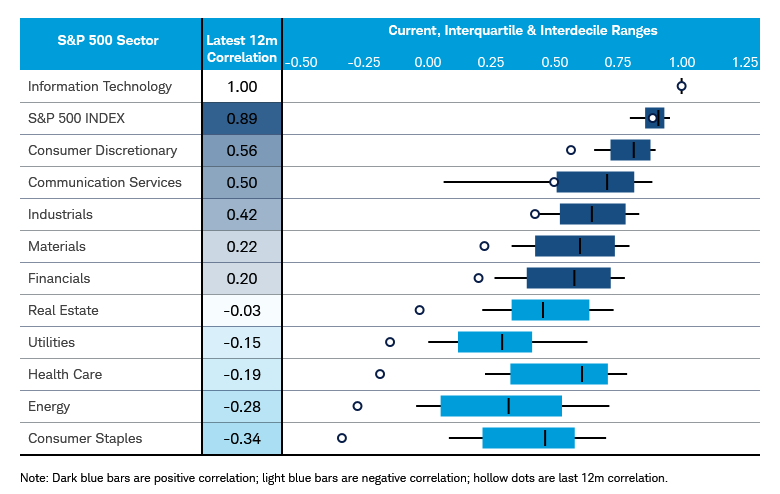
The following chart shows S&P 500 sector correlations to the S&P 500 Tech sector. The chart shows the range of each sector's correlation to Tech over the last 10 years with the box plot representing interquartile range (the range of 25th to 75th percentile) and the whisker for the interdecile range (the range of 10th to 90th percentile). The hollow dots on the chart represent correlations to the Tech sector over the last 12 months. Note that most of these dots are well below the historical range. This represents a more recent decoupling between Tech and the rest of the market and reflects the improved diversification opportunity through sectors.
S&P 500 sector correlations to the Information Technology sector over the past 10 years
Source: Charles Schwab, Bloomberg, and Macrobond data, as of 8/5/2026.
Global Industry Classification Standard (GICS®) was developed by and is the exclusive property of MSCI Inc. (MSCI) and Standard & Poor’s (S&P). GICS is a service mark of MSCI and S&P and has been licensed for use by Charles Schwab & Co, Inc. Past performance is no guarantee of future results.
Correlation is a statistical measure of how two investments have historically moved in relation to each other, and ranges from -1 to +1. A correlation of +1 indicates a perfect positive correlation, while a correlation of -1 indicates a perfect negative correlation. A correlation of zero means the assets are not correlated.
Increasing exposure to sectors with low correlation to technology themes tends to provide diversification, but that does not guarantee outperformance, nor prevent losses. Investors are faced with the choice to accept the status quo of (1) holding the highly concentrated market portfolio with returns dominated by a handful of stocks and one major theme; or (2) rebalancing allocations away from the concentrated areas, which could risk underperforming the broader market should technology and the AI-related stocks continue to outperform. The choice depends on one's time horizon, sensitivity to relative market performance, risk appetite, and achieving goal objectives.
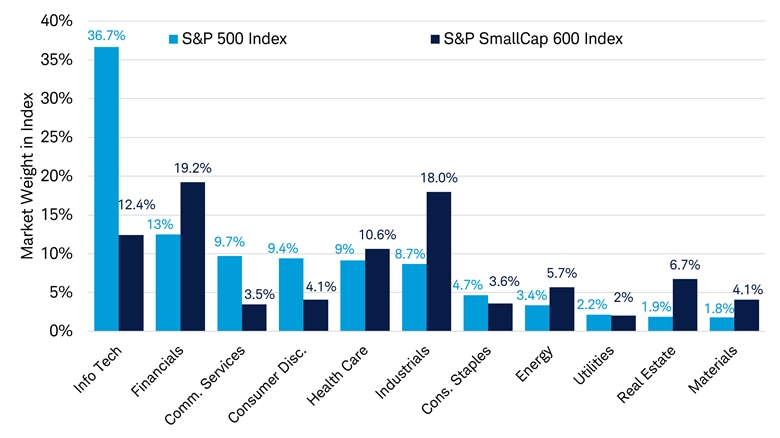
Another way to broaden portfolio exposures is via style factor, including increasing exposure to small- and mid-cap stocks. The S&P SmallCap 600 Index has a more balanced sector exposure relative to the S&P 500. Factor indices like Value and Dividend Yield are other examples that have low correlations to Tech.
Schwab clients can use the Schwab ETF Select List to screen for sector-focus funds.
Current sector exposures in the S&P 500 and S&P SmallCap 600 Index
Source: Charles Schwab and Bloomberg, data as of 7/31/2026.
For illustrative purposes only. Global Industry Classification Standard (GICS®) was developed by and is the exclusive property of MSCI Inc. (MSCI) and Standard & Poor’s (S&P). GICS is a service mark of MSCI and S&P and has been licensed for use by Charles Schwab & Co, Inc.
Diversification opportunity No. 3: Alternative index construction
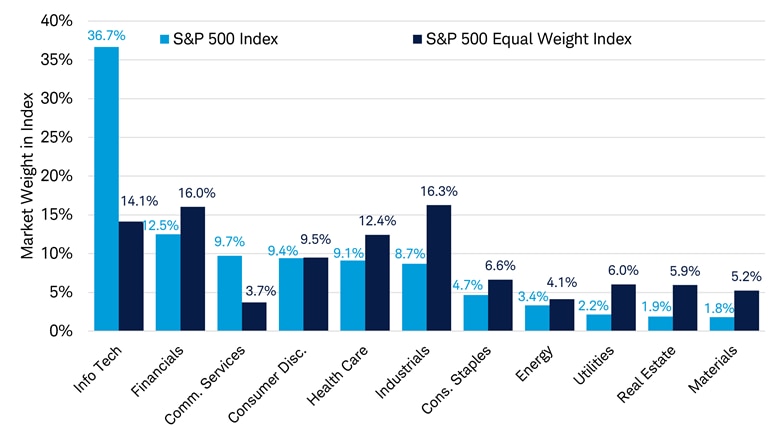
While market-cap weighting methodologies are the most prominent, there are a range of other approaches behind index construction. One simple example that increases diversification is the S&P 500 Equal Weight Index, which allocates the same weight (0.20%) to each of the S&P 500 constituents and rebalances these exposures quarterly. This doesn't mean all sectors have the same weight, just that all individual companies do. Sector weights are largely driven by the number of companies in each sector not the number of stocks—so if one sector has more constituents, it will have a higher sector weight.
As the chart below shows, the S&P 500 Equal Weight Index has a more balanced allocation across sectors versus the market capitalization-weighted S&P 500 Index, with the biggest exposure difference across the largest companies in the index. The top 10 largest companies make up 38% of the market capitalization weighted S&P 500 Index, but those same companies have just a 2% weight in the S&P 500 Equal Weight Index.
Current sector exposures in the S&P 500 and S&P 500 Equal Weight Index
Source: Charles Schwab and Bloomberg, data as of 7/31/2026.
For illustrative purposes only. Global Industry Classification Standard (GICS®) was developed by and is the exclusive property of MSCI Inc. (MSCI) and Standard & Poor’s (S&P). GICS is a service mark of MSCI and S&P and has been licensed for use by Charles Schwab & Co, Inc.
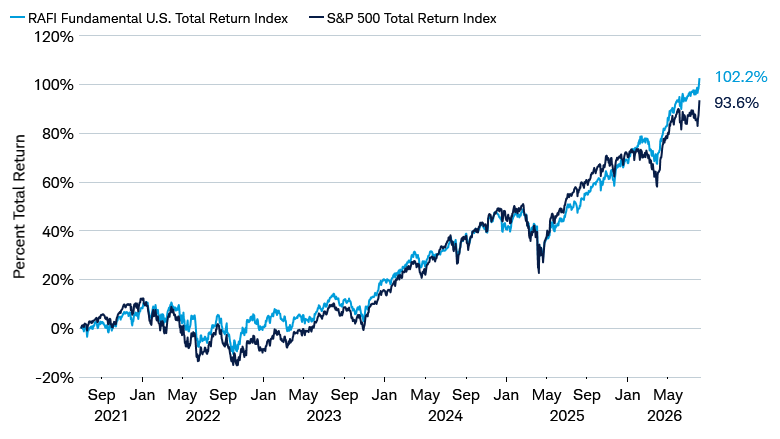
Another option investors can explore is fundamental indexing, which builds and weights portfolios by company revenue growth, profitability, cash flow generation, yield, or other company fundamentals, and can offer exposure to targeted company characteristics rather than just exposure to the companies with the largest market value.
The RAFI Fundamental U.S. Index, a fundamentally weighted index strategy of large-cap U.S. stocks, is often used as a benchmark for these strategies. This index has actually managed to outperform the S&P 500 over the last five years despite significant compositional differences.
Five-year total return performance of the RAFI Fundamental U.S. Index and the S&P 500 Index
Sources: Charles Schwab, Bloomberg, S&P, Research Affiliates, and Macrobond, data from 6/30/2021 through 8/4/2026.
Indexes are unmanaged, do not incur management fees, costs, and expenses and cannot be invested in directly. Dividends and interest are assumed to have been reinvested, and the example does not reflect the effects of taxes or fees which would cause performance to be lower.
Total return performance has been indexed to 0 as of 6/30/2021. The RAFI index construction methodology is available at www.rafi.com/knowledge-center/questions/rkc-68.
Past performance is no guarantee of future results.
The following table shows the difference in top 10 holdings both by weight and by sector exposure between the RAFI High Liquidity U.S. Large Cap Index and the S&P 500 Index.
RAFI Fundamental High Liquidity U.S. Large Cap Index and S&P 500 Index
| Top 10 RAFI Holdings | Weight | Top 10 S&P 500 Holdings | Weight | |
|---|---|---|---|---|
| 1. | Apple | 4.3% | NVIDIA | 8.1% |
| 2. | Microsoft | 2.7% | Apple | 6.8% |
| 3. | Exxon Mobile | 2.3% | Microsoft | 5.5% |
| 4. | Alphabet (A) | 2.0% | Alphabet (A) | 5.1% |
| 5. | Amazon | 1.9% | Amazon | 4.0% |
| 6. | Berkshire Hathaway Inc | 1.6% | Broadcom | 3.0% |
| 7. | JPMorgan Chase | 1.6% | Meta | 1.9% |
| 8. | Alphabet (C) | 1.6% | Micron | 1.6% |
| 9. | United Health | 1.5% | JPMorgan Chase | 1.5% |
| 10. | Chevron | 1.5% | Berkshire Hathaway Inc | 1.4% |
| Sum Top 10 | 21.1% | Sum Top 10 | 38.8% |
Diversification opportunity No. 4: Single stock
For investors interested in individual stocks, the Schwab Stock Screener can help find stocks that may be useful for adding diversification. To access the Screener, log on to Schwab.com. From the menu at the top select Research and then Stocks. Next, select the Stock Screener.
We analyzed the correlation of sectors and industries in the Russell 3000 Index to a basket of AI-related stocks. We have ranked each sector of the index by correlation with this basket over the past two years. The Utilities, Consumer Staples, Energy, Health Care, and Real Estate Sectors had the lowest correlations.
Correlation of sectors in the Russell 3000 Index to a basket of AI-related stocks
| Russell 3000 Sector | Correlation to AI stock basket |
|---|---|
| Utilities | 0.08 |
| Consumer Staples | 0.10 |
| Energy | 0.16 |
| Health Care | 0.21 |
| Real Estate | 0.22 |
| Communication Services | 0.25 |
| Materials | 0.28 |
| Consumer Discretionary | 0.28 |
| Financials | 0.30 |
| Industrials | 0.32 |
| Information Technology | 0.38 |
Schwab clients can access the Schwab Stock Screener to screen for large capitalization stocks. To run similar analysis, set your screening parameters to the following:
- Basic > Sectors and Industries > Consumer Staples
- Basic > Market Capitalization > $50B or more
In the table below, we list the five largest companies by market capitalization in each of the Consumer Staples, Energy, Health Care, Real Estate, and Utilities sectors, which are the sectors with the lowest correlation to Technology.
Five largest companies by market capitalization in each of the Consumer Staples, Energy, Health Care, Real Estate, and Utilities sectors
| Company Name | GICS Sector | Market Cap ($ Mln) |
|---|---|---|
| WALMART INC | Consumer Staples | 891,862 |
| COSTCO WHOLESALE CORP | Consumer Staples | 420,928 |
| COCA-COLA CO/THE | Consumer Staples | 373,676 |
| PROCTER & GAMBLE CO/THE | Consumer Staples | 341,622 |
| PHILIP MORRIS INTERNATIONAL | Consumer Staples | 293,097 |
| EXXONMOBIL HOLDINGS CORP | Energy | 641,727 |
| CHEVRON CORP | Energy | 373,875 |
| CONOCOPHILLIPS | Energy | 140,268 |
| MARATHON PETROLEUM CORP | Energy | 84,037 |
| VALERO ENERGY CORP | Energy | 87,239 |
| ELI LILLY & CO | Health Care | 1,122,041 |
| JOHNSON & JOHNSON | Health Care | 619,296 |
| ABBVIE INC | Health Care | 430,947 |
| UNITEDHEALTH GROUP INC | Health Care | 366,863 |
| MERCK & CO. INC. | Health Care | 317,051 |
| WELLTOWER INC | Real Estate | 170,096 |
| PROLOGIS INC | Real Estate | 134,540 |
| EQUINIX INC | Real Estate | 103,887 |
| AMERICAN TOWER CORP | Real Estate | 79,772 |
| SIMON PROPERTY GROUP INC | Real Estate | 71,937 |
| NEXTERA ENERGY INC | Utilities | 176,474 |
| SOUTHERN CO/THE | Utilities | 104,821 |
| DUKE ENERGY CORP | Utilities | 96,642 |
| CONSTELLATION ENERGY | Utilities | 94,595 |
| AMERICAN ELECTRIC POWER | Utilities | 68,191 |
Investment implications
The underlying composition of equity indices is changing all the time. This can be a benefit to investors holding investments that track index funds as index composition typically shifts toward those companies and industries showing strong fundamental growth. But it can also be a risk if broad indices become dominated by any one particular source of return. A challenge for investors today is that the Technology sector now accounts for an unusually large share of global index composition and is expected to deliver more than half the entire global equity market’s earnings growth for 2026, according to consensus estimates and our calculations.
From our perspective, the combination of market cap and earnings concentration—and the circularity of these conditions (including the large reliance on the AI theme)—is where the risks add up.
These considerations do not mean we foresee an imminent end to the AI investment cycle or the powerful earnings growth it's generating. Rather, we acknowledge that there are any number of possible outcomes of this current technological innovation story. However, high Tech sector valuations combined with elevated earnings expectations imply that markets are discounting a quite optimistic outcome, based on our analysis. From this perspective, we see the risk outlook having shifted to the downside; that is, there are now greater downside risks than upside ones.
While we can’t predict how the AI innovation cycle will play out, we believe more active diversification can potentially improve risk-adjusted returns across a range of potential scenarios. This isn't a call to abandon the Tech sector or those companies most benefiting from the related investment cycle, but we do believe more actively diversifying portfolios is warranted. Of course, diversification alone does not ensure a profit nor protect against losses.