Weekly Trader's Outlook
Stocks Edge Higher in Choppy Week as Investors Digest Heavy News Flow

The Week That Was
If you read the last week's blog, you might recall that my forecast for this week was "Moderately Bearish," citing the bearish price action in the $COMP/NDX and an elevated VIX. Stocks had a choppy week but are on track for modest gains so my forecast turned out to be wrong. There was a lot for markets to digest this week, so let me attempt to sum up the high-level takeaways for investors:
- The U.S. Supreme Court (SCOTUS) ruled against President Donald Trump's global International Emergency Economic Powers Act (IEEPA) tariffs in a 6-3 decision. It is estimated that $133.5B was collected in IEEPA tariffs in 2025. In response, President Trump said he will sign an order today to impose 10% global tariffs under section 122 of the Trade Act of 1974.
- President Trump earlier this week said that Iran has "10 to 15 days at most" to agree to a deal over its nuclear program. Earlier today, Trump told reporters he is considering a limited military strike on Iran. WTI crude oil prices are up 5.7% this week.
- This week's economic data had a bearish tilt: Q4 gross domestic product (GDP) came in at 1.4%, below the 2.5% expected (though it is estimated the government shutdown negatively impacted the print by ~1.0%); the Atlanta Fed Nowcast for Q1 GDP was revised 0.5% lower to 3.1% today; The S&P Flash Composite Purchasing Managers' Index (PMI) came in at a 10-month low; the December personal consumption expenditures (PCE) price index rose 0.4%, the largest jump since last February with the +2.9% year-over-year gain representing the largest yearly increase since March of 2024. Minutes from the January Federal Open Market Committee (FOMC) meeting had a hawkish tilt. Treasury yields are on track to be modestly higher on the week, and Federal Reserve rate cut probabilities are down as a 25-basis-point cut at the June FOMC meeting currently stands at 58% (down from 85% last Friday).
- Q4 earnings scorecard: out of the 425 S&P 500 companies that have reported results, 66% have beat on the top line while 75% have beat on the bottom line. Revenue growth has been +8.93% year-over-year (YoY) while earnings-per-share (EPS) growth is tracking at 12.36%.
- The Nasdaq is on track to gain 1.4% on the week, but funds tracking the software industry are on track to be down 1-2%. And this is despite news on Tuesday that ServiceNow (NOW) executives have canceled all future planned stock sales. Additionally, ServiceNow CEO Bill McDermott entered into a share purchase agreement on February 13th to buy $3M of common stock at the prevailing market price on February 27th. Therefore, investor sentiment around this space remains cautious/skeptical on lingering AI disruption concerns [note: Salesforce (CRM) and Snowflake (SNOW) report next Wednesday].
Outlook for Next Week
At the time of this writing (2:25 p.m. ET) stocks are mostly higher, but off the highs of the session in what has been a volatile trading session (DJI + 152, SPX + 41, $COMP + 202, RUT - 2). It has been a volatile trading session today given all the news flow, and it seems likely that stocks could be subject to more volatility next week: a) I'm not sure that markets have priced in all of the tariff ramifications yet; b) tensions around the U.S and Iran remain heading into the weekend; c) there are two key tech earnings reports next Wednesday (NVDA and CRM) which have the potential to introduce some binary (higher or lower) price action; d) the VIX remains elevated at 19-20, perhaps due in part to Iran uncertainty, bearish seasonality. Therefore, I'm providing an overall "Higher Volatility" forecast for next week. I'm not expecting the VIX to necessarily rise from here (since I believe Iran uncertainty is contributing to the elevated levels), but I just feel that the potential for some larger-than-expected swings, either higher or lower, are in the cards. What could challenge my forecast? Iran de-escalation or "as expected" results from both NVDA and CRM would likely result in a calmer than expected week.
Other Potential Market-Moving Catalysts
Economic:
- Monday (Feb. 23): Factory Orders, Fed Governor Christopher Waller speaks
- Tuesday (Feb. 24): Consumer Confidence, Chicago Fed President Austan Goolsbee, Atlanta Fed President Raphael Bostic, and Fed Governor Lisa Cook all speak, Wholesale Inventories, S&P Case-Shiller Home Price Index
- President Trump’s State of the Union Address (9:00 p.m. ET)
- Wednesday (Feb. 25): Richmond Fed President Tom Barkin speaks, EIA Crude Oil Inventories
- Thursday (Feb. 26): Continuing Claims, EIA Natural Gas Inventories, Initial Claims
- Friday (Feb. 27): Construction Spending, Producer Price Index (PPI)
Earnings:
- Monday (Feb. 23): BWX Technologies Inc. (BWXT), Diamondback Energy Inc. (FANG), Dominion Energy Inc. (D), Domino's Pizza Inc. (DPZ), Keysight Technologies Inc. (KEYS), ONEOK Inc. (OKE), Woodside Energy Group Ltd. (WDS)
- Tuesday (Feb. 24): Alibaba Group Holding Ltd. (BABA), American Tower Corporation (AMT), Axon Enterprises Inc. (AXON), Constellation Energy Corp. (CEG), EOG Resources Inc. (EOG), Home Depot Inc. (HD), MercadoLibre Inc. (MELI), NRG Energy Inc. (NRG), Realty Income Corp. (O), Workday Inc. (WDAY)
- Wednesday (Feb. 25): Bank of Montreal (BMO), Diageo PLC (DEO), HEICO Corp. (HEI), HSBC Holdings PLC (HSBC), Lowe's Companies Inc. (LOW), NVIDIA Corp. (NVDA), Nu Holdings Ltd. (NU), Salesforce Inc. (CRM), Snowflake Inc. (SNOW), Synopsys Inc. (SNPS), TJX Companies Inc. (TJX)
- Thursday (Feb. 26): Argenx SE (ARGX), Autodesk Inc. (ADSK), Baidu Inc. (BIDU), Cheniere Energy Inc. (LNG), CoreWeave Inc. (CRWV), Dell Technologies Inc. (DELL), Intuit Inc. (INTU), Monster Beverage Corp. (MNST), Royal Bank of Canada (RY), Sempra (SRE), Toronto-Dominion Bank (TD), Vistra Corp. (VST)
- Friday (Feb. 27): BrightSpring Health Services (BTSG), Chart Industries Inc. (GTLS), Enel Chile S.A. (ENIC), Frontline PLC (FRO), Pearson PLC (PSO), Sociedad Quimica y Minera de Chile S.A. (SQM), TXNM Energy Inc. (TXNM)
Economic Data, Rates & the Fed
There was a healthy dose of economic data for markets to digest this week, and the batch had a bearish tilt in my view. First, yes Q4 GDP was impacted by the government shutdown (and the corresponding drop in federal spending), but even if you add in the estimated 1.0% impact, it would have been below 0.1% below estimates. Second, this morning's S&P Flash PMI reports came in below estimates and at multi-month lows. Third, the Atlanta Fed's Nowcast for Q1 GDP was revised down 0.5% to 3.1% (I understand this is a volatile data point). And finally, expectations around future rate cuts from the Fed took a hit due to a warm PCE print and a relatively hawkish January FOMC Minutes. On the plus side, weekly jobless claims came in well below estimates. Here's a breakdown of the reports:
- PCE Prices: Headline MoM prices increased 0.4% in December, up from +0.2% in November and above the +0.3% economists had expected. This translates into a YoY gain of 2.9%, which was an uptick from 2.8% in November.
- PCE Prices – Core: Headline core prices increased 0.4% MoM (above the +0.3% expected) and +3.0% on a YoY basis (an acceleration from the +2.8% in November).
- Q4 GDP: U.S. gross domestic product rose 1.4%, which was well below the +2.5% economists had expected. However, the Commerce Department estimated that the government shutdown negatively impacted the reading by roughly 1.0%, since government spending took a significant drop.
- Personal Income: +0.3% vs. +0.2% est.
- Personal Spending: +0.4% vs. +0.4% est.
- S&P Flash U.S. Composite PMI: Dropped to a 10-month low of 52.3 in February from 53.0 in January.
- S&P Flash U.S. Services PMI: Dropped to a 10-month low of 52.3 in February from 52.7 in January.
- S&P Flash U.S. Manufacturing PMI: Dropped to a seven-month low of 51.2 in February from 52.4 in January.
- Consumer Sentiment: Ticked up to 56.6 in February from 56.4 in January, but below the 57.3 economists were expecting.
- New Home Sales: Came in above estimates in both November (758K vs. 740K est.) and December (745K vs. 738K est.)
- Initial Jobless Claims: Initial applications for U.S. jobless benefits fell by 23K from last week to 206K, which was below the 223K economists had expected. Continuing Claims rose 17K from the prior week to a seasonally adjusted 1.869M.
- EIA Crude Oil Inventories: -9M barrels.
- EIA Natural Gas Inventories: -360 bcf.
- Fed Minutes (January FOMC): Fed officials were divided on how to proceed with future monetary policy, driven by debate over sticky inflation vs. soft labor market. The minutes suggested that many members felt a pause is appropriate for now and rate cuts could continue later this year only if inflation cooperates. Some officials said that rate hikes could be a consideration.
- The Atlanta Fed's GDPNow "nowcast" for Q1 GDP was revised down to 3.1% today from 3.6% last week.
U.S. Treasury yield curve experienced some volatility this week, but the net results is higher yields across the board. Yields initially dropped on this morning's soft Q4 GDP reading, and despite warmer PCE prices, but then got some lift following the SCOTUS ruling against Trump's tariffs. Compared to last Friday, two-year Treasury yields are higher by ~7 basis points (3.484% vs. 3.41%), while 10-year yields (4.094% vs. 4.056%), and 30-year yields (4.736% vs. 4.699%) are both higher by ~4 basis points.
Market expectations for rate cuts from the Federal Reserve in 2026 took a significant drop this week, primarily driven by this morning's hotter-than-expected PCE report. Wednesday's relatively hawkish Fed minutes impacted rate cuts hopes as well. Per Bloomberg, the probability of a 25-basis-point cut from the Fed in March moved down to 5% from 10%, April eased to 18% from 30%, while June currently stands at 57% from 85% (all week-over-week).
Technical Take
Nasdaq 100 Index (NDX + 123 to 24,920)
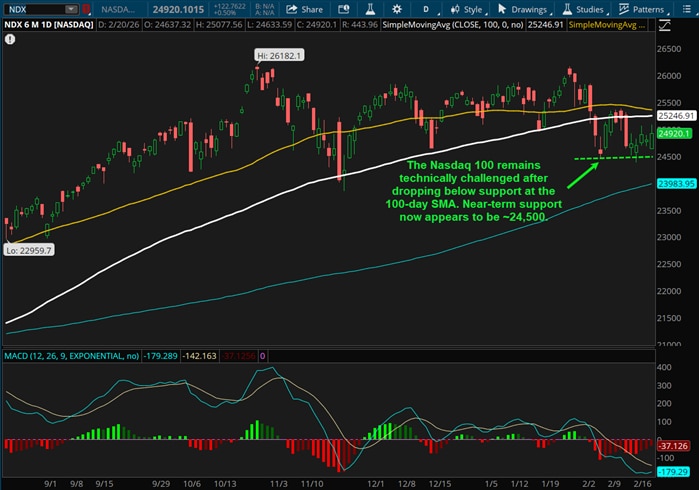
Last week I had a bearish technical assessment on the Nasdaq 100 (NDX), noting the potential bearish confirmation (bearish pullback) as the index failed to reclaim ground above the 100-day Simple Moving Average (SMA). The NDX is on track to be up slightly on the week, but it still remains below this longer-term moving average. Mega-cap tech stocks have performed better recently, but investor skepticism still remains on software stocks due to AI disruption concerns. Next Wednesday we are not only getting quarterly earnings from Nvidia (NVDA), but also Salesforce (CRM). Both of these reports hold the potential to influence investor sentiment around the tech space in my view. Salesforce is down 30% in two months and is hovering around a 52-week low, so if the company's results demonstrate that AI is helpful, rather than harmful, to their business model, this could help repair the psychology around the AI disruption theme. We'll have to wait and see, but until then I've got near-term support around 24,500 and near-term resistance at the 100-day SMA (~25,250) with a slightly bearish technical view.
Near-term technical translation: slightly bearish

Source: ThinkorSwim trading platform
Past performance is no guarantee of future results.
S&P 500 Index (SPX + 13 to 6,874)
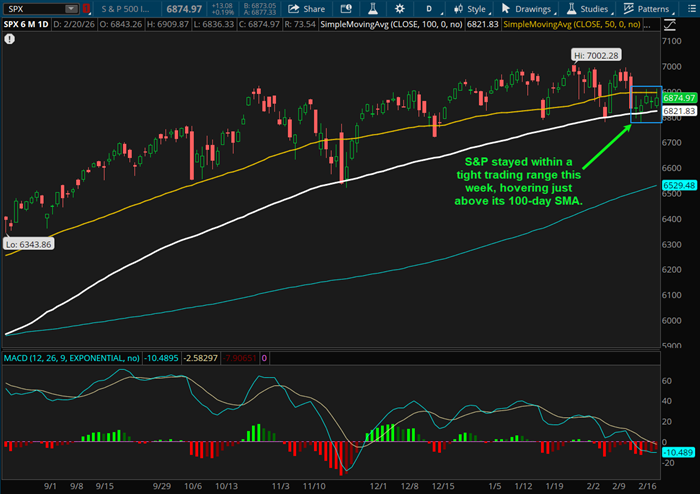
The market-cap weighted S&P 500 index (SPX) is up slightly on the week, but I'd describe the price action as choppy and sideways. The bullish technical perspective would point out that the 100-day Simple Moving Average (SMA) has held up as support. The bearish technical view might highlight the high frequency of "support tests" at this moving average, which could lend to an eventual break to the downside. In other words, it's technically more bullish to see a "V" bounce off key support levels, rather than multiple tests in a short period of time. I'm a little torn because of this, but since the SPX has held ground, thus far, above this indicator, I'll stick with my "slightly bullish" perspective from last week.
Near-term technical translation: slightly bullish

Source: ThinkorSwim trading platform
Past performance is no guarantee of future results.
Cryptocurrency News
This week was once again relatively quiet as sentiment across the crypto market remained negative. Yesterday, bitcoin’s mining difficulty was adjusted higher after falling nearly 20% from its peak. Historically this has been a signal that a bitcoin selloff is at or near a trough, and miners are now restarting operations after temporarily shutting down.
Bitcoin’s correlation to software stocks has been gaining attention recently. This has resulted in a narrative that bitcoin is a high-beta growth stock as opposed to digital gold. The top three positions in the North American Expanded Tech Software Index—Microsoft (MSFT), Oracle (ORCL) and Palantir (PLTR)—make up almost 30% of the index. These stocks have been components of the momentum factor for several years. Until last year, when market leadership started to broaden out, mega cap AI companies and bitcoin were some of the few areas of the market that were seeing growth, and as a result, were all components of the momentum factor. On a long-term basis bitcoin is a low-correlation asset, but there have been several periods throughout its history where it has been correlated with equities. Bitcoin’s recent weakness is more attributable to a selloff in the momentum factor as opposed to being a high-beta growth stock. That said, the digital gold narrative also needs to be put into perspective. Bitcoin is considered digital gold because it is a supply constrained asset with low correlations to other asset classes. As money supply grows, bitcoin supply grows at a slower pace, resulting in a supply/demand mismatch—assuming demand is stable over time. The major difference between the two is that gold is considered a safe haven, while bitcoin is viewed as a risk asset, given its inverse correlation to credit spreads.
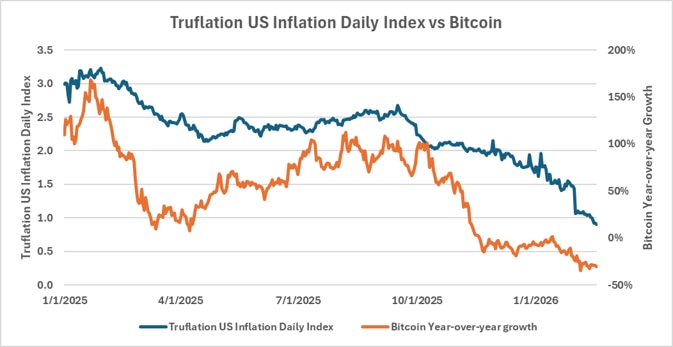
Have bitcoin investors been pricing in deflation? Over the past few years, M2 Money Supply has been growing slower than its long-term average growth rate of 6%. More recently, the Truflation US Inflation Daily Index, a real-time measure of consumer prices, has seen its annual growth rate fall from nearly 3% to less than 1%. Historically, bitcoin has exhibited a low correlation to CPI, as it is primarily seen as a hedge against monetary inflation. Consumer prices can rise and fall for factors other than monetary inflation, such as product shortages, though monetary inflation still has an impact on consumer prices. Recently bitcoin has exhibited a strong correlation to the Truflation US Inflation Daily Index. Many investors have been debating why bitcoin’s price action was relatively muted this cycle compared to previous halving cycles, especially given new demand from mainstream investors through spot exchange traded products. While slower growth can be attributed to maturation of the crypto market and the sharp decline that began in the fall due to excess leverage, some investors may have been discounting disinflation, and potentially even deflation.

Source: Bloomberg L.P.
Market Breadth
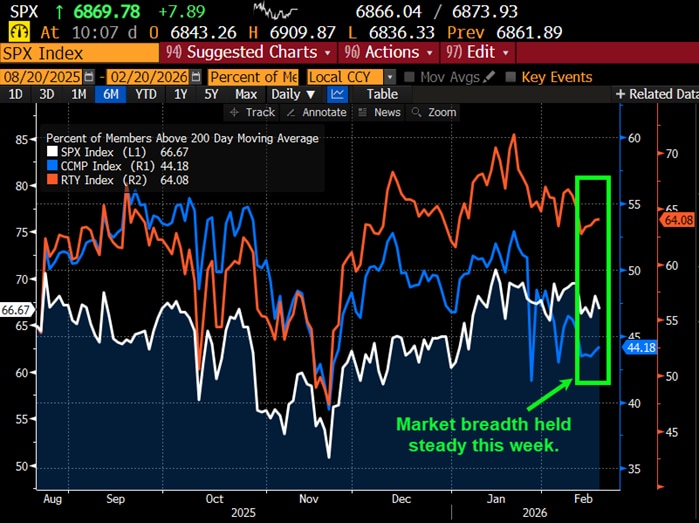
The Bloomberg chart below shows the current percentage of members within the S&P 500 (SPX), Nasdaq Composite (CCMP), and Russell 2000 (RTY) that are trading above their respective 200-day Simple Moving Averages (SMA). In short, stocks are on track to be modestly higher on the week and market breadth mostly held steady. Market breadth on the SPX experienced some modest contraction while the RUT experienced a nice bump. In fact, market breadth on the S&P 500 moved higher. Compared to last Friday's, the SPX (white line) breadth moved down to 64.08% from 66.20% and the CCMP (blue line) ticked up to 44.18% from 43.45%, while the RUT jumped to 66.67% from 62.72%.

Source: Bloomberg L.P.
Market breadth attempts to capture individual stock participation within an overall index, which can help convey underlying strength or weakness of a move or trend. Typically, broader participation suggests healthy investor sentiment and supportive technicals. There are many data points to help convey market breadth, such as advancing vs. declining issues, percentage of stocks within an index that are above or below a longer-term moving average, or new highs vs. new lows.
This Week's Notable 52-week Highs (78 today): AstraZeneca PLC (AZN + $0.32 to $206.77), Burlington Stores Inc. (BURL + $3.92 to $316.72), Canadian National Railway Inc. (CNI + $0.53 to $109.96), FedEx Corp. (FDX + $7.01 to $390.15), Lumentum Holdings Inc. (LITE + $19.34 to $654.98), Ross Stores Inc. (ROST + $1.40 to $201.78)
This Week's Notable 52-week Lows (66 today): Booking Holdings Inc. (BKNG + $57.53 to $4,064.98), Booz Allen Hamilton Holding Corp. (BAH - $3.19 to $76.74), Domino’s Pizza Inc. (DPZ + $2.76 to $387.89), FactSet Research Systems Inc. (FDS + $1.69 to $200.57), Nice Ltd. (NICE + $4.16 to $115.71), Roper Industries Inc. (ROP + $2.97 to $334.97)