More Than Meets the Eye: How to Read Stock Quotes
December 23, 2025
Beginner
New to investing and never ventured past the buy/sell buttons? Start by learning how to read stock quotes and other technical information.
A common mistake beginning investors make is thinking a stock trading for $300 is more valuable than one trading for $100. Not necessarily. While knowing a stock's price can be helpful, the price reflects far more than what investors pay to buy a share.
By learning various factors that shape a stock price, including buy and sell orders, historical highs, the percentage of shares held by institutions, market caps, and more, investors can form a more comprehensive view of the stock before making a trading decision. This can potentially help them understand what makes a stock a good buy or a bad one.
Schwab.com is a good place to start. The Research tab offers many basic price angles and price summary information to be aware of when approaching a trade. Understanding these can help prevent another common beginning investor mistake: jumping in without understanding why a stock is priced how it is.
The following explains dozens of common fundamental and technical price metrics investors might want to know before buying stock, what they mean, and how to find them on Schwab.com.
The Schwab Research tab offers price angles and price summary information.
Dynamics of stock price movement: Technical factors
Markets (and the stocks within them) constantly fluctuate—sometimes a lot; sometimes a little. A stock might be close to its highs or lows, which is an important thing to know when buying or selling.
A stock's profile contains information like where the stock has been, both on an intraday basis and historically, helping explain its current price in relation to short- and long-term trends. This can make a difference in terms of technical chart patterns many traders chose to follow.
To check any stock quote, head to the Research tab and select Research Tools, then Stocks. Next, type in the stock symbol. As shown in the chart below, this will pull up the stock's profile, which includes the following technical dynamics just below the name of the stock:
- Bid and ask: The latest price bid for the stock along with the ask price from the seller.
- Previous close: The price of a stock at the end of the previous trading day.
- Today's open: The first price at which a stock traded after the current day's opening bell.
- Today's volume: Indicates the size of the volume of shares being traded for the individual stock. If volume so far today is above or below average, it's helpful to know for a sense of how much conviction a move might have.
- Today's range: Tracks how high and low a stock has traded since the current day's open; this range may expand throughout the day.
- 52-week range: The highest and lowest price a stock traded at in the last year (52 weeks). One-year highs and lows are typically considered "critical" levels, especially when a stock trades above its one-year high (possibly a bullish signal) or below its one-year low (possibly a bearish signal).
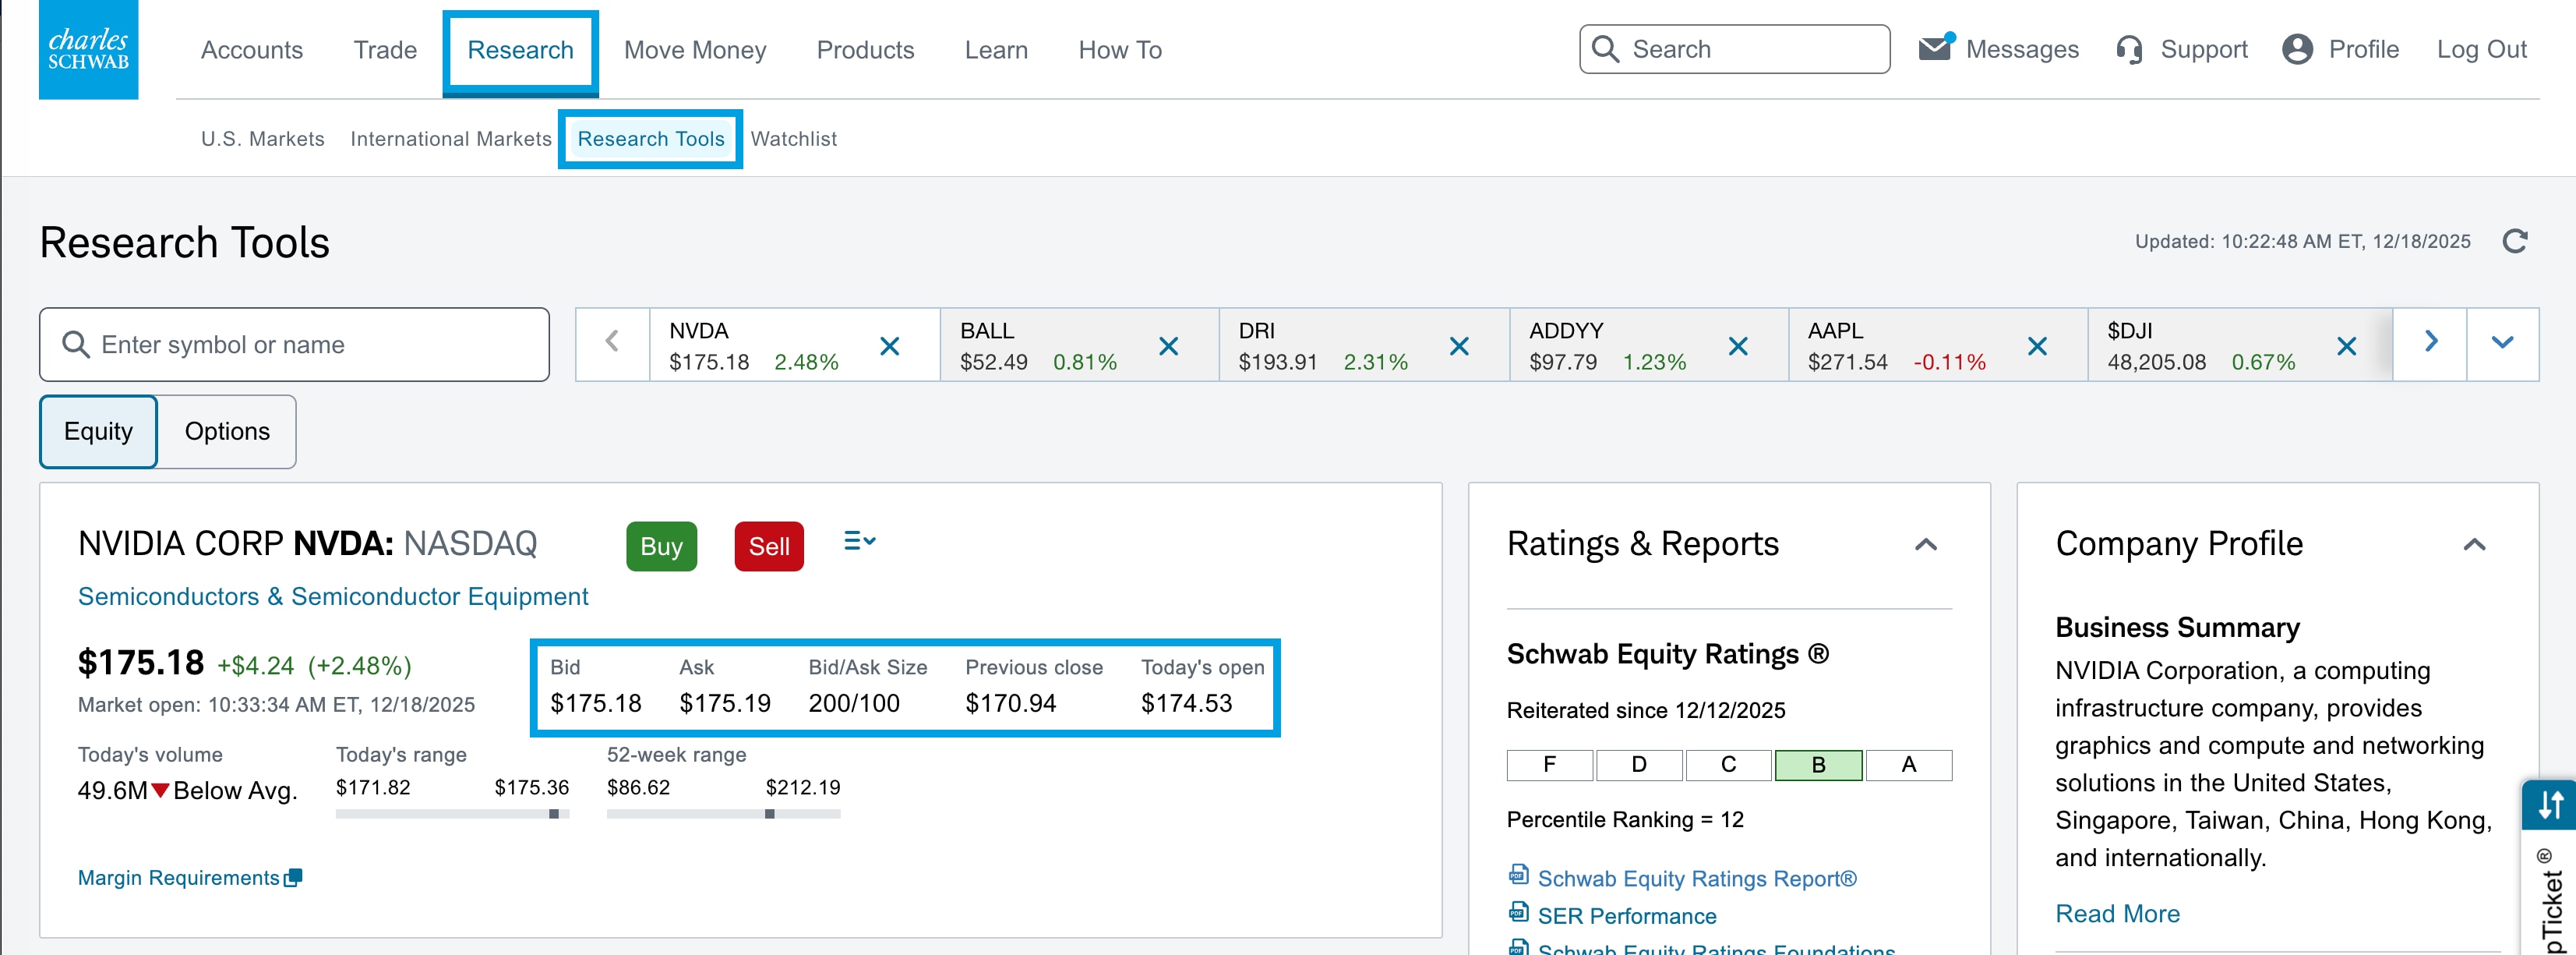
Source: Schwab.com
After reviewing the top section of the stock profile, scroll down to the Technicals section for the following information:
- Beta (5 Year): Beta is similar to historical volatility as a gauge, but it's more about the company's volatility relative to the broader market. If a stock's beta is one, then it's expected to move roughly with the broader market; if it's greater than one, it might be more volatile than the broader market. By definition, the S&P 500® index (SPX) has a beta of one.
- Average Volume: This figure looks at how a stock's price deviates from its past price over a certain period of time. Time periods include 10 day and 90 day.
- Moving Averages: These indicators show the stock's average price over key time periods, including the past 20, 50, and 200 trading days.
- Historical Volatility (10 Day): This figure looks at how a stock's price deviates from its past overall price during certain periods of time. The higher a stock's historical volatility percentage, the greater its volatility risk.
- Trend Analysis: This subsection, next to the average volume readings, gives a brief explanation of recent technical trends.
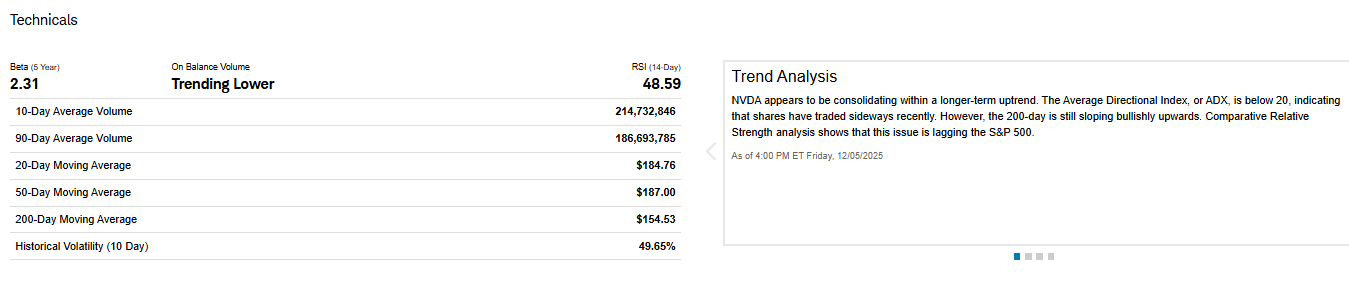
Source: Schwab.com
As investors likely know, past performance does not guarantee future results. That means there's no actual predictive power in these technical stock price dynamics. Many traders consider other indicators like momentum, range, consolidation, breakouts, and more to help inform their decisions on direction and timing.
Fundamental analysis concepts
In contrast to technical analysis, fundamental analysis looks at a company from within—its financial metrics, business model, profitability, and so forth. This information can be found in the Share Profile section and the Dividends and Earnings sections directly below the stock's news headlines.
Although entire books are produced on fundamental analysis, a quick overview includes some of the following:
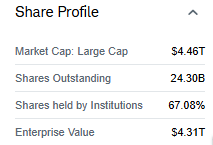
- Market Capitalization: The total current dollar value of a company's shares on the open market. A significant change in share value, changes in the number of shares issued, and the exercise of any warrants on a company's stock can change a company's market cap.
- Shares Outstanding: Indicates how many shares are currently held by all shareholders, including large institutional investors and even the company's officers and employees.
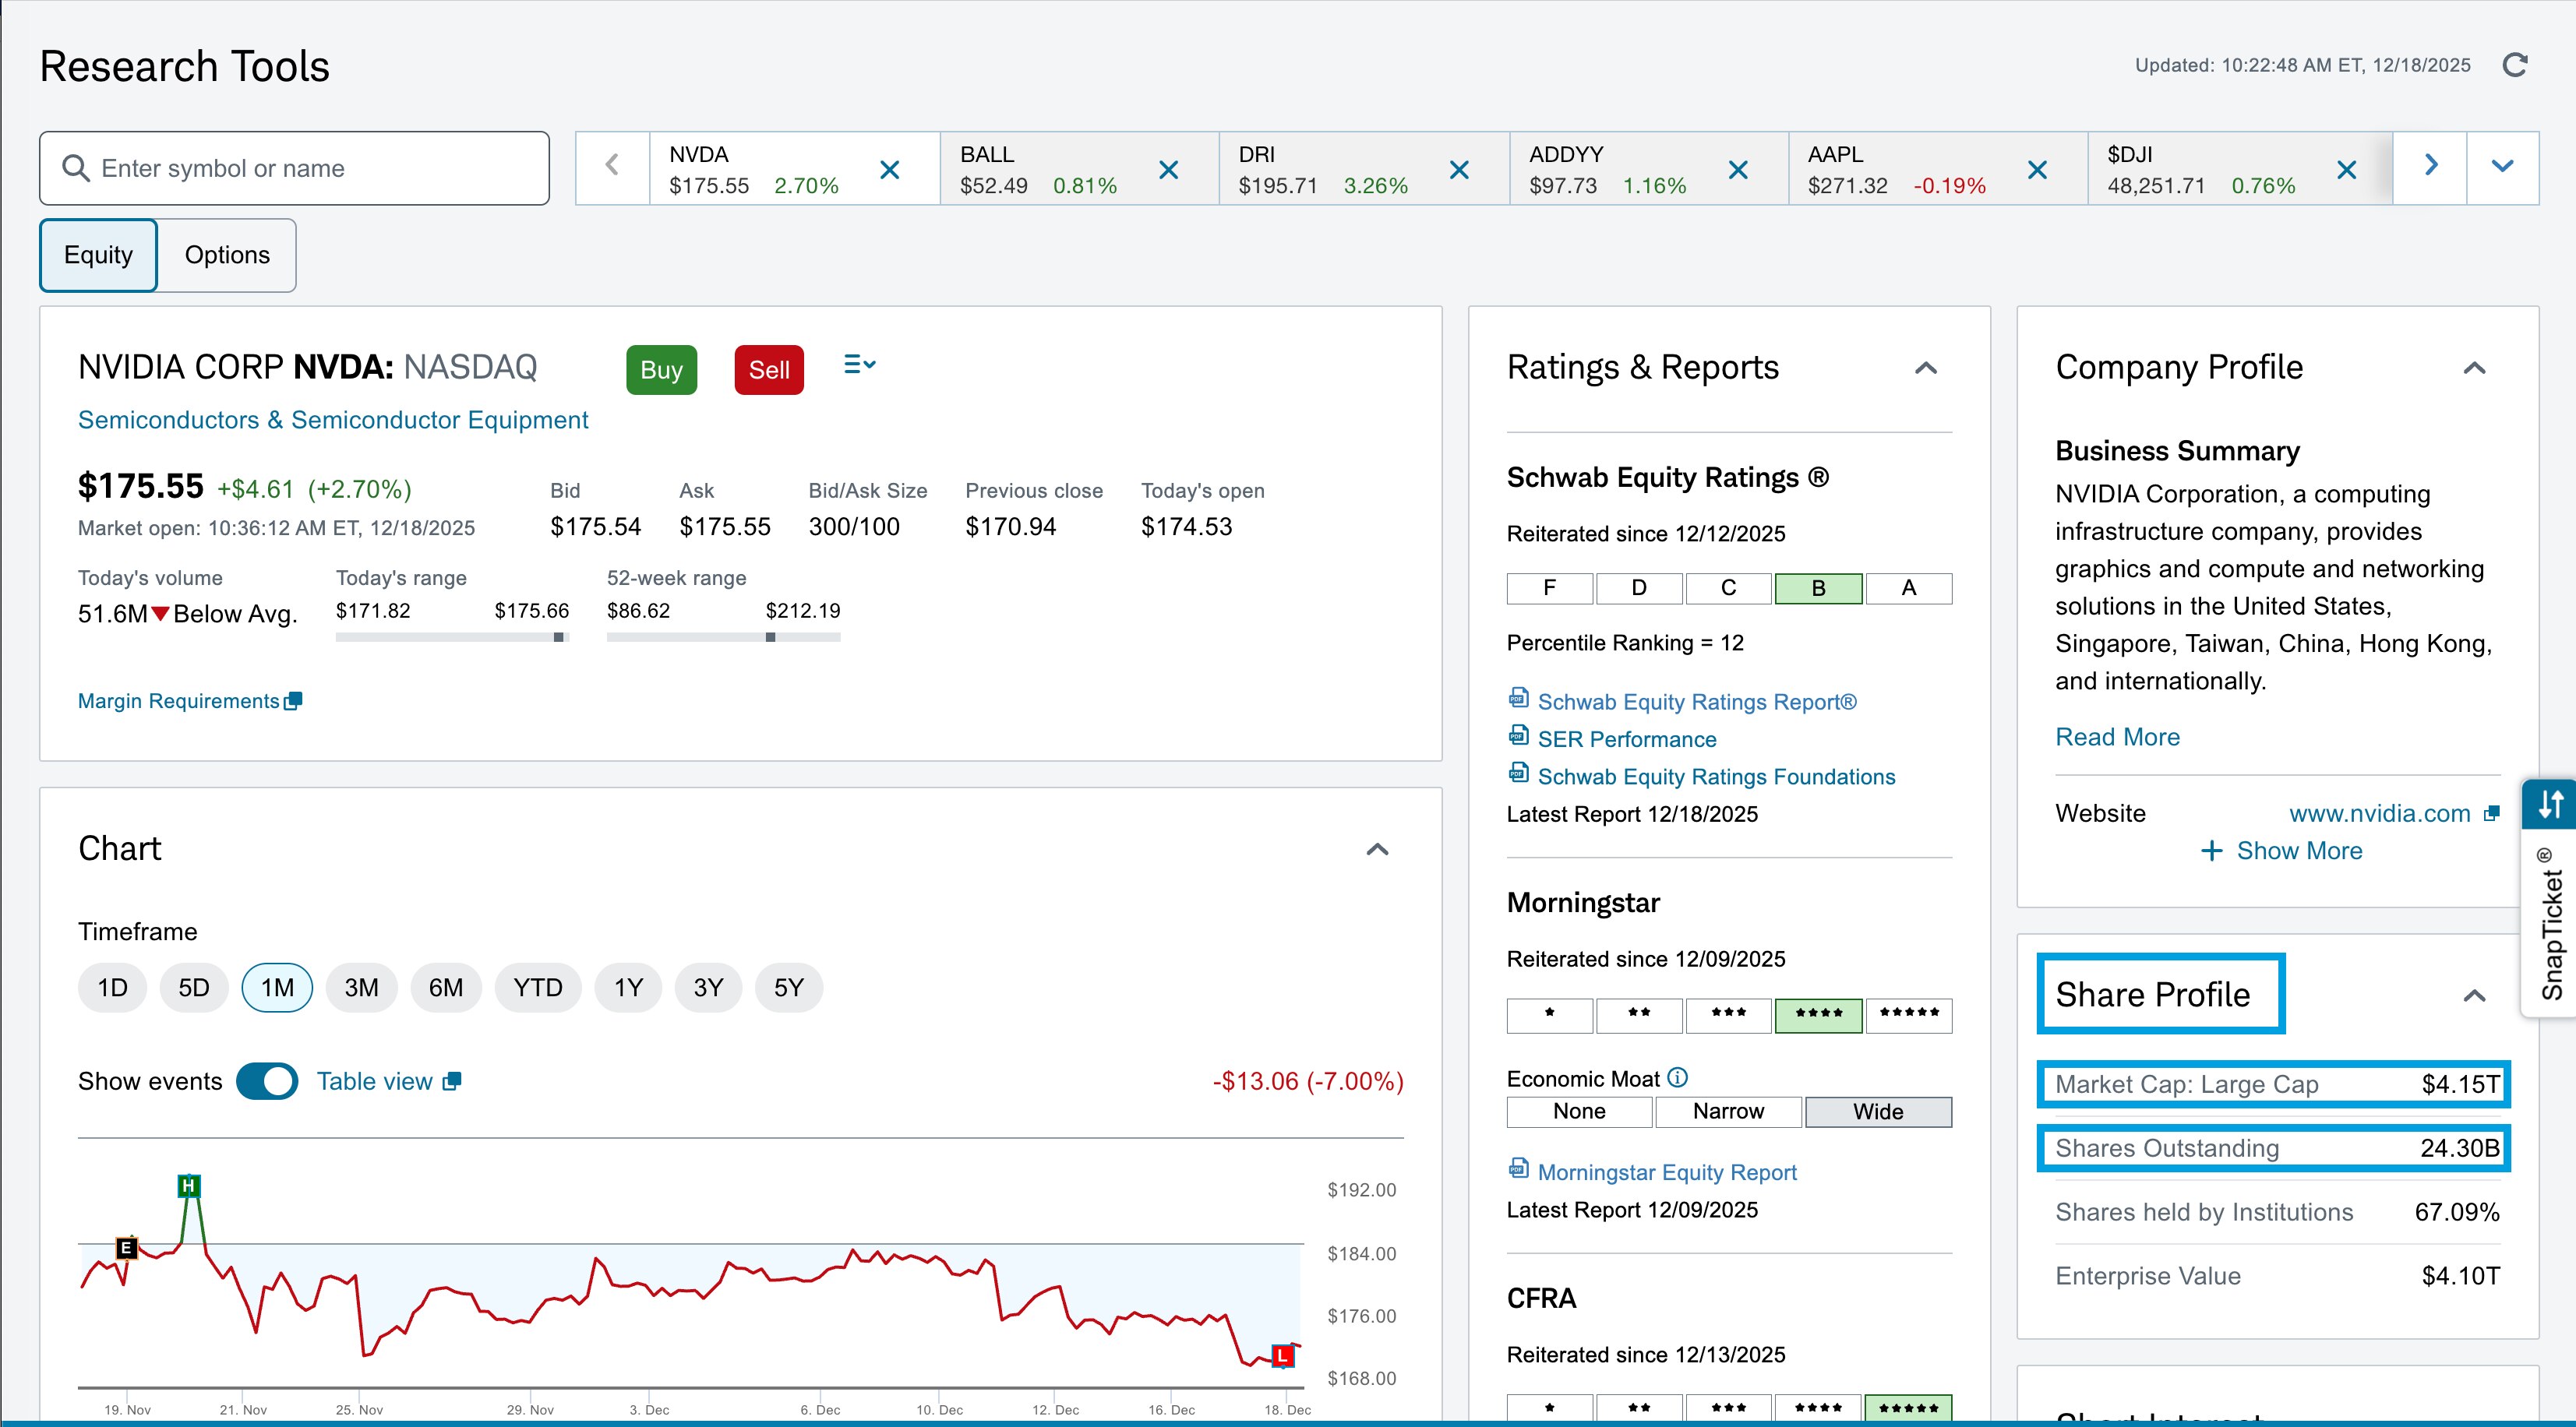
Source: Schwab.com
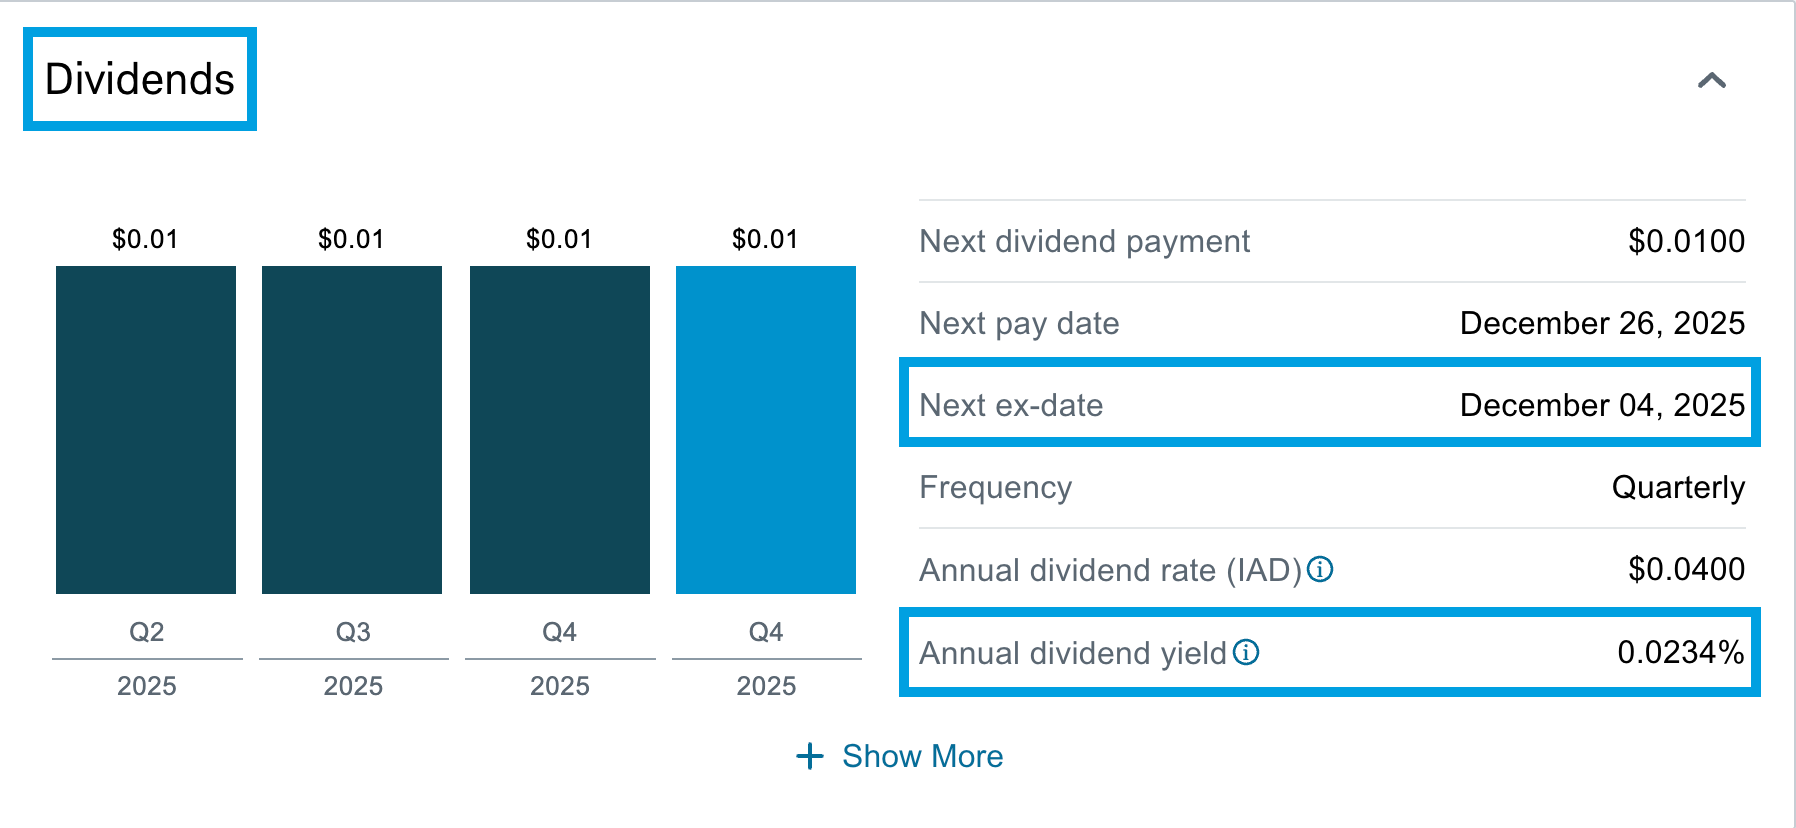
- Next-Ex Date: This is the cut-off date for the next round of dividends. Anyone who purchased shares on or after the ex-dividend date might have to wait for the next dividend pay period. For option traders, it's particularly important to know dividend dates and how they can affect options prices and positions.
- Annual Dividend Yield: This looks at a company's dividend history to indicate how much investors might expect to receive in annual dividend payments per share. It's usually indicated in dollar and percentage values. But no dividend is guaranteed. A company can choose to change its dividend offerings at any time, so anyone investing in a stock mainly for its dividends might want to keep an eye out for changes. The same can be said for the profitability measures above. They can and do change, which is why many investors stay glued to corporate earnings each quarter.
Source: Schwab.com
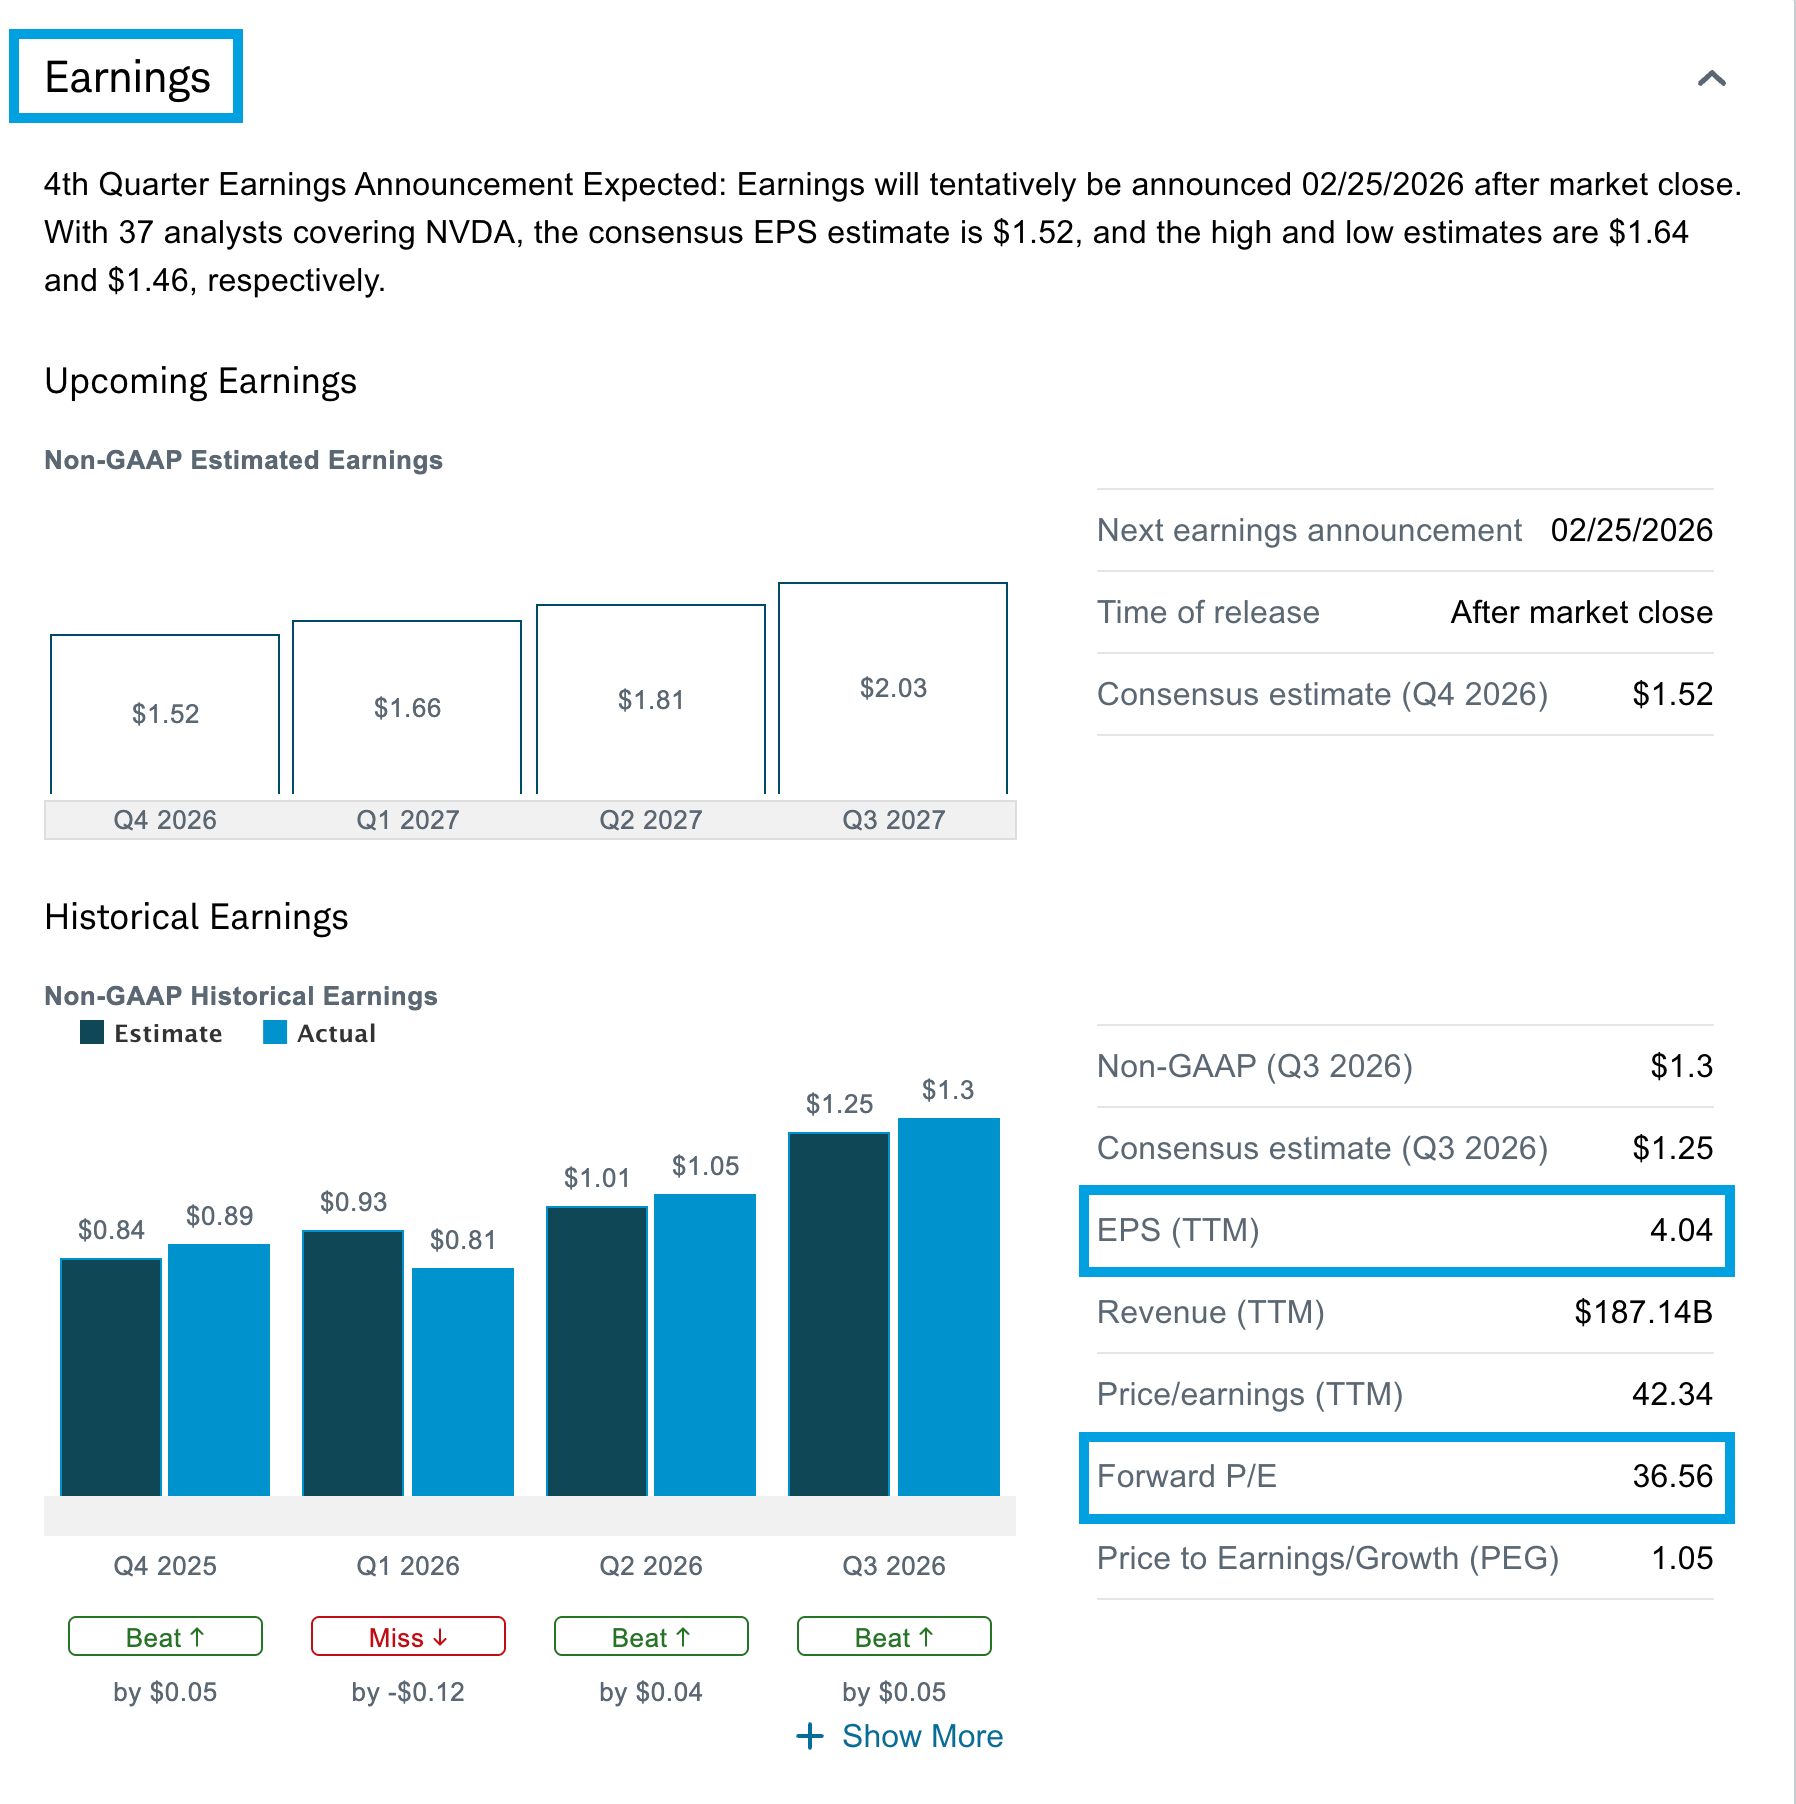
- Earnings per share (EPS): Indicates how a company's net profit is reflected in each share of stock. EPS is derived by dividing a company's net profit by its total outstanding common shares. It's one of two metrics (the other being revenue) that analysts often forecast for the coming earnings quarter.
- Forward price-to-earnings (P/E) ratio: Shows how much investors are currently paying for a stock above its estimated future per-share earnings. This is perhaps the most widely used metric among investors, but it has some blind spots and should be considered in conjunction with other metrics.
Source: Schwab.com
Who's invested?
Some investors like to know who the big players are—those holding the stock as well as those who think it's primed for a pullback.
Shares held by Institutions: The data in the Share Profile, explains how much of a company's total shares are owned by larger financial institutions, such as investment banks, pension funds, mutual funds, hedge funds, and insurance companies.
来源:Schwab.com 网站
Institutional investors are seen as being in it for the long haul. Plus, institutions often have professional money managers who are vetting stocks to include. But other funds—such as index funds—are bound by the criteria set forth in the fund's prospectus. So, it's not a perfect metric.
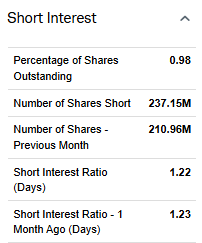
Short Interest (Percentage of Shares Outstanding): Directly below the Share Profile, this information indicates the ratio of shares sold short from the total number of shares available for trading (the float).
来源:Schwab.com 网站
There are two ways to look at short interest. First, when the ratio of short interest to float is elevated, above 0.20 (20%), this might suggest sentiment is bearish. Second, when the ratio is above 0.50 (50%) and the stock quickly rallies, short sellers might have a difficult time buying back shares to cover. This can drive prices up due to a short squeeze.
Bottom line
These metrics are a lot to digest all at once, but learning how to interpret them is part of becoming an educated investor. Anyone who wants to trade using more complex metrics found on Schwab.com or Schwab's thinkorswim® platform should only consider doing so once they have the hang of these, because it all starts with understanding the stock quote and other summary information.